A demo, available here, shows just how different the service is from Google Analytics.
Check out the video below to see GoSquared in action.
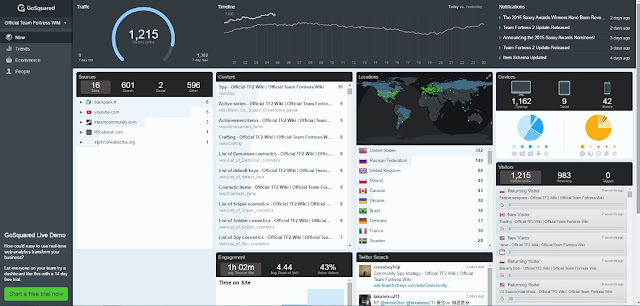
First of all, it’s evident that GoSquared is focused much more on real-time data. The main page of the analytics page, titled “Now,” provides looks into metrics that are almost constantly changing for this demo site.Check out the video below to see GoSquared in action.
As the number of visitors online changes, the “Sources” section also changes, showing how people got to the site. The “Content” section is also changing, which shows what pages the visitors are clicking on. Also, in the “Location” section, dots appear on the map, indicating from where in the world the visitors are viewing the site. The “Device” section breaks down from which device the user is viewing the page from.
All of these metrics are also available on Google Analytics Real-Time Overview page. However, GoSquared takes this view much more in-depth, by providing information on how many of these visitors are new or returning, and which page each of these visitors are clicking on.
GoSquared also states that its visitors and time on site data is more accurate than Google Analytics. Its time on site data is compiled through pinging, which means a small signal is sent at regular interval, letting GoSquared know that a visitor is still on the page. The visitors don’t have to click anything for their time to keep being measured, as is necessary for Google Analytics (2).
GoSquared also calculates active visitors differently than Google Analytics. According to GoSquared, this is done by “combining a number of factors including whether or not a visitor has your website open in their frontmost tab or window, mouse movements, scroll position, and key strokes.” On the other hand, GA defines an active user based on whether that user has “Triggered an event of pageview within the last 5 minutes” (2).
Also available on this view is the “Twitter search” section, which provides a live stream of tweets that match the search term that has been selected. This can be set up to include multiple search terms, so for this blog, I could set up a Twitter search feed for “ACW marketing” and “ACWmarketing,” for example, or I could also search for a marketing term relating to my latest blog post so I could track the term’s popularity on Twitter in real time (3).
Another interesting feature on this page is the dropdown on the “Sources” section, which provides details on which specific page led the visitor to the site. The “Sources” section can be filtered by sites, search, social and other. The “Search” section provides the list of keywords people are using to get to the site, while the “Social” section shows which social sites are bringing people to the site. For example, this demo shows a specific Reddit page linking to the site. When I clicked on the link, it takes me to a Reddit thread mentioning the site.

The “Trends” page of GoSquared can be customized to show data from the day, week, month or year. The data available includes:
- Sources – what sites, social media platforms or keywords brought visitors to the site, and how many visitors each of these brought.
- Content – what pages people are visiting, ranked by number of visitors for the selected time period.
- Devices – what devices are people using to access the site, and how many people are using each one. This can be brown down by browser type as well as operating system and screen size.
- Location – how many people are viewing the site from various countries. Surprisingly this cannot be broken down by state or region.
- Languages – what language each person who visits the page speaks, calculated by settings on the visitor’s browser (4).
Here is where Google Analytics pulls ahead. GA offers so much more, and so many more options, when it comes to looking at trends. A GA user can also look at all of the data GoSquared’s “Trends” section provides, but it can provide a much more in-depth look. For example, Google Analytics also shows how many people viewed each page during a specific time period. Clicking on that specific page shows how many of those pageviews were unique, the average time on page, how many people entered the site through that page, how many people bounced from the page, and how many people exited from the page. 

This type of information is not available on GoSquared. A toggle at the top of the “Trends” page on GoSquared does let users see total visits, total visitors, total pageviews, bounce rate, average time per visit, and average pageviews per visit. However, there is no breaking this data down per page. This is important data that would seem to me to be key for most marketers, as it could help them diagnose problems with a page and help them find which pages are under-performing.
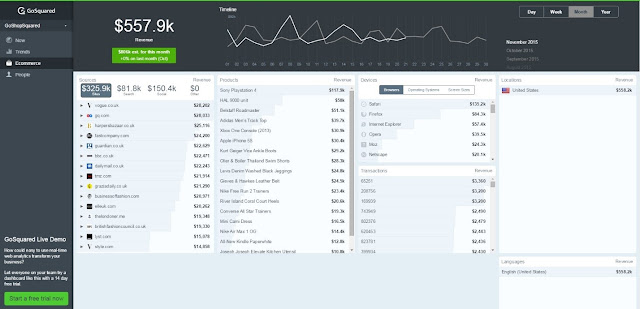
Another section of GoSquared, the “Ecommerce” tab:


The top of the page provides a toggle that shows revenue, conversion rate, quantity, transactions, average order total, and visits. Below that, GoSquared provides information on what sources led to conversions, as well as how much revenue is due to each source. It also lists products that are selling, in order of popularity, with how much revenue each one has led to. Other information includes which browsers people are using to convert sales, their operating systems, and their screen sizes. Transactions are also provided in real time, with each transaction number and its corresponding revenue.
Google Analytics can also provide this type of information, but, again, allows users to learn even more about these transactions. For example, not only can a GA user see how many units of a certain item have been sold; they can also see the number of unique purchases of that product. That is, how many transactions included that certain item. Users can also see the average quantity of that item sold per transaction (5).
Of course, another huge advantage to Google Analytics is that it is free. GoSquared can cost anywhere from $9 to $99 a month, and users can choose the best option based on how many pageviews the site typically gets. However, if the site goes over that number of pageviews for the month, the user can’t see any more GoSquared data until the next month, unless they want to bump up to the more expensive plan. This could be a problem if it is used as the primary analytics tool for a site (6).
So, overall, Google Analytics can do so much more than GoSquared. It allows its users to take a much deeper look at the data, and provides data on just about every web-related metric imaginable. GoSquared is much simpler to use, because it doesn’t overwhelm its users with all of this data. It provides more of a look at the surface. Its real-time analytics are useful, and may provide valuable information to its users without much thought. However, this would have to be done by having someone constantly monitor the “Now” section of the tool. If a marketer wants to get an in-depth look at the overall success of a site, Google Analytics seems to be a much better option.
References:
1. https://www.gosquared.com/about/
2. https://www.gosquared.com/customer/portal/articles/930050-why-is-my-gosquared-data-different-to-google-analytics
3. https://www.gosquared.com/customer/en/portal/articles/611589-twitter-search
4. https://www.gosquared.com/customer/en/portal/articles/607249-languages
5. https://www.optimizesmart.com/e-commerce-tracking-works-google-analytics-ultimate-guide/
6 http://blog.crazyegg.com/2013/01/09/alternatives-to-google-analytics/


No comments:
Post a Comment